Introduction & pre-processing
Stacked & grouped bar chart
Bubble chart
Introduction
In this short KNIME tutorial, we visualize the Olympic dataset derived from the Wikipedia entry on All-time Olympic games medals, as of the 2016 Summer Olympics and 2018 Winter Olympics. All changes in medal standings due to doping cases and medal redistributions, including 25-Nov-2020, are considered.
The KNIME workflow along with the data can be downloaded here
Using the CSV reader node, we read the CSV file containing the dataset into the KNIME table. Then perform data cleaning and preprocessing operations to get a more usable data table to meet the desired purpose.
Top ten countries
Get the top ten countries that have the most medals in the summer and winter games.
We use the Top k Selector node to select the top ten countries with the most medals

Bar chart
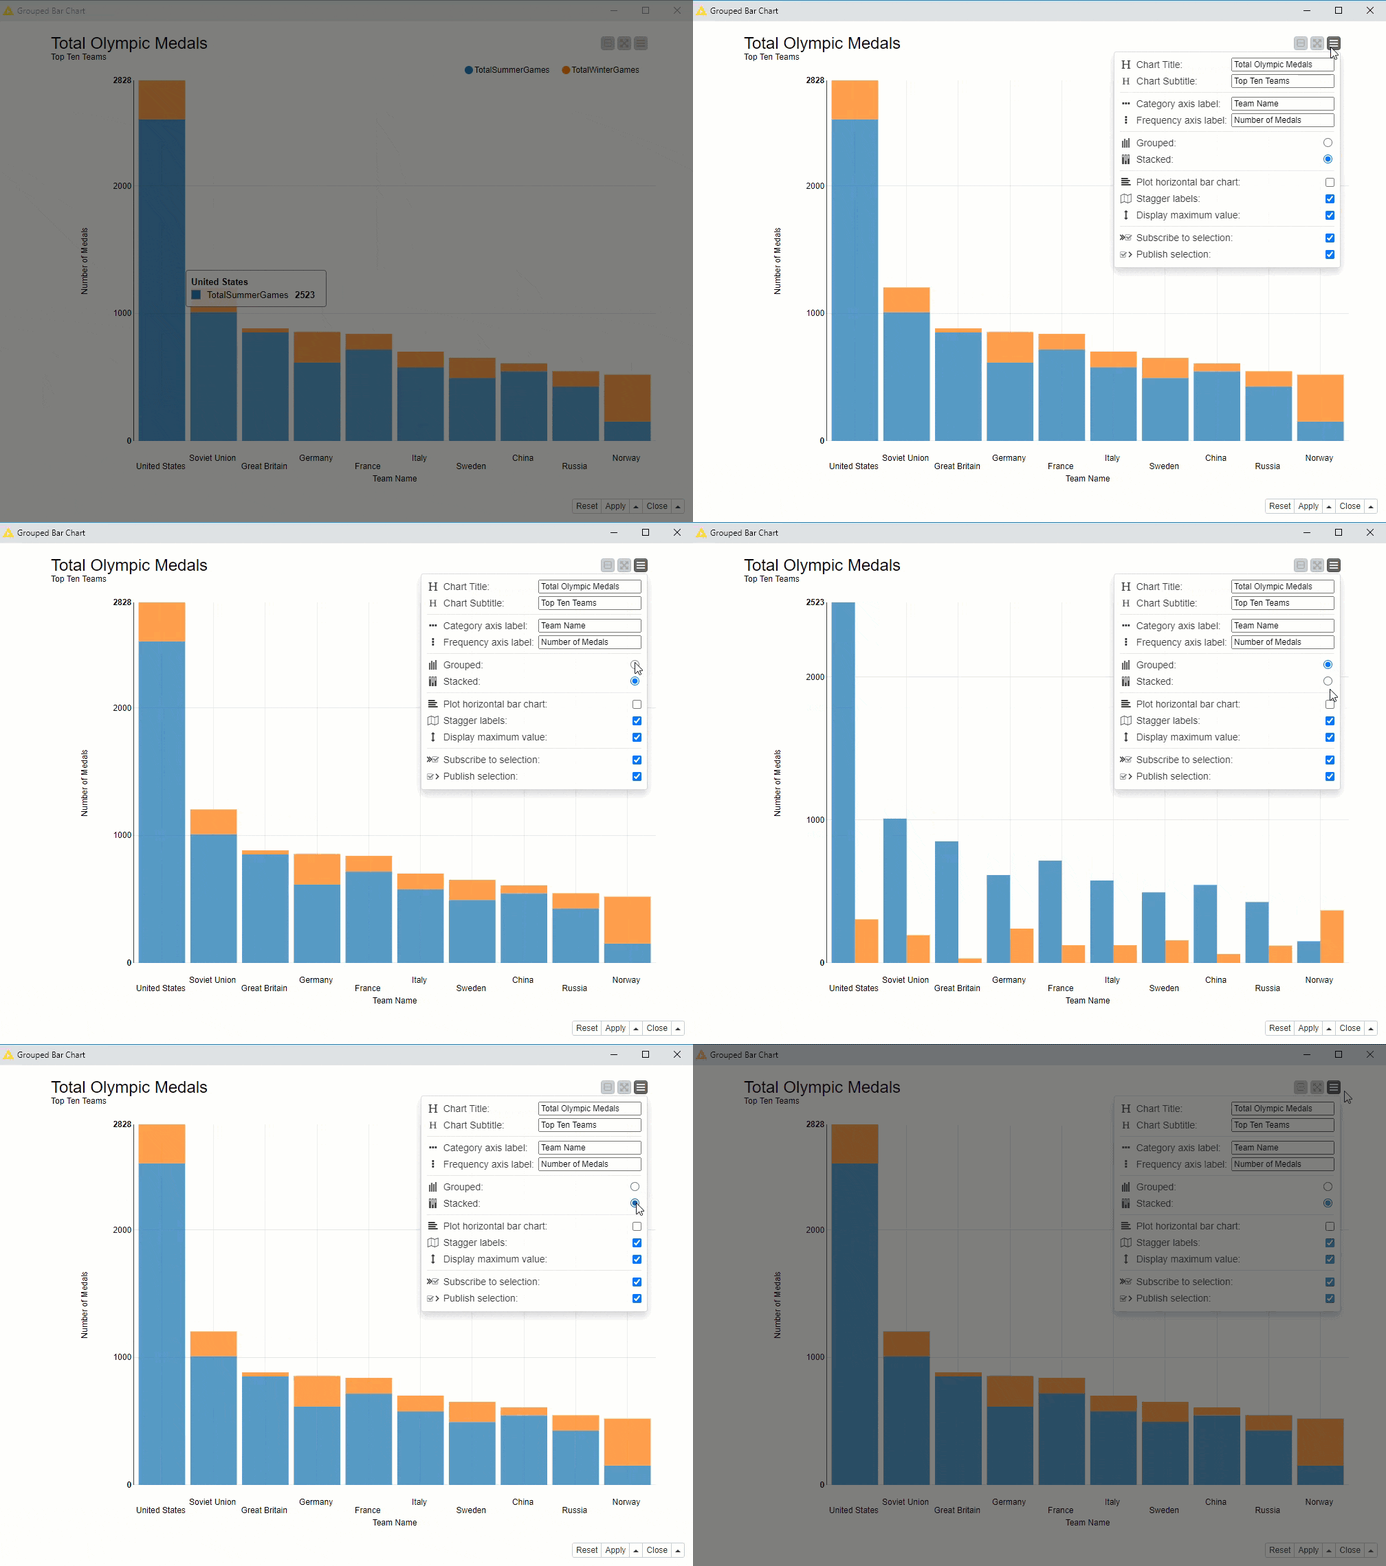
We use the JavaScript Bar Chart node to create an interactive stacked and grouped bar chart representing the top ten countries in terms of the total number of medals in the winter and summer games.

Bubble chart
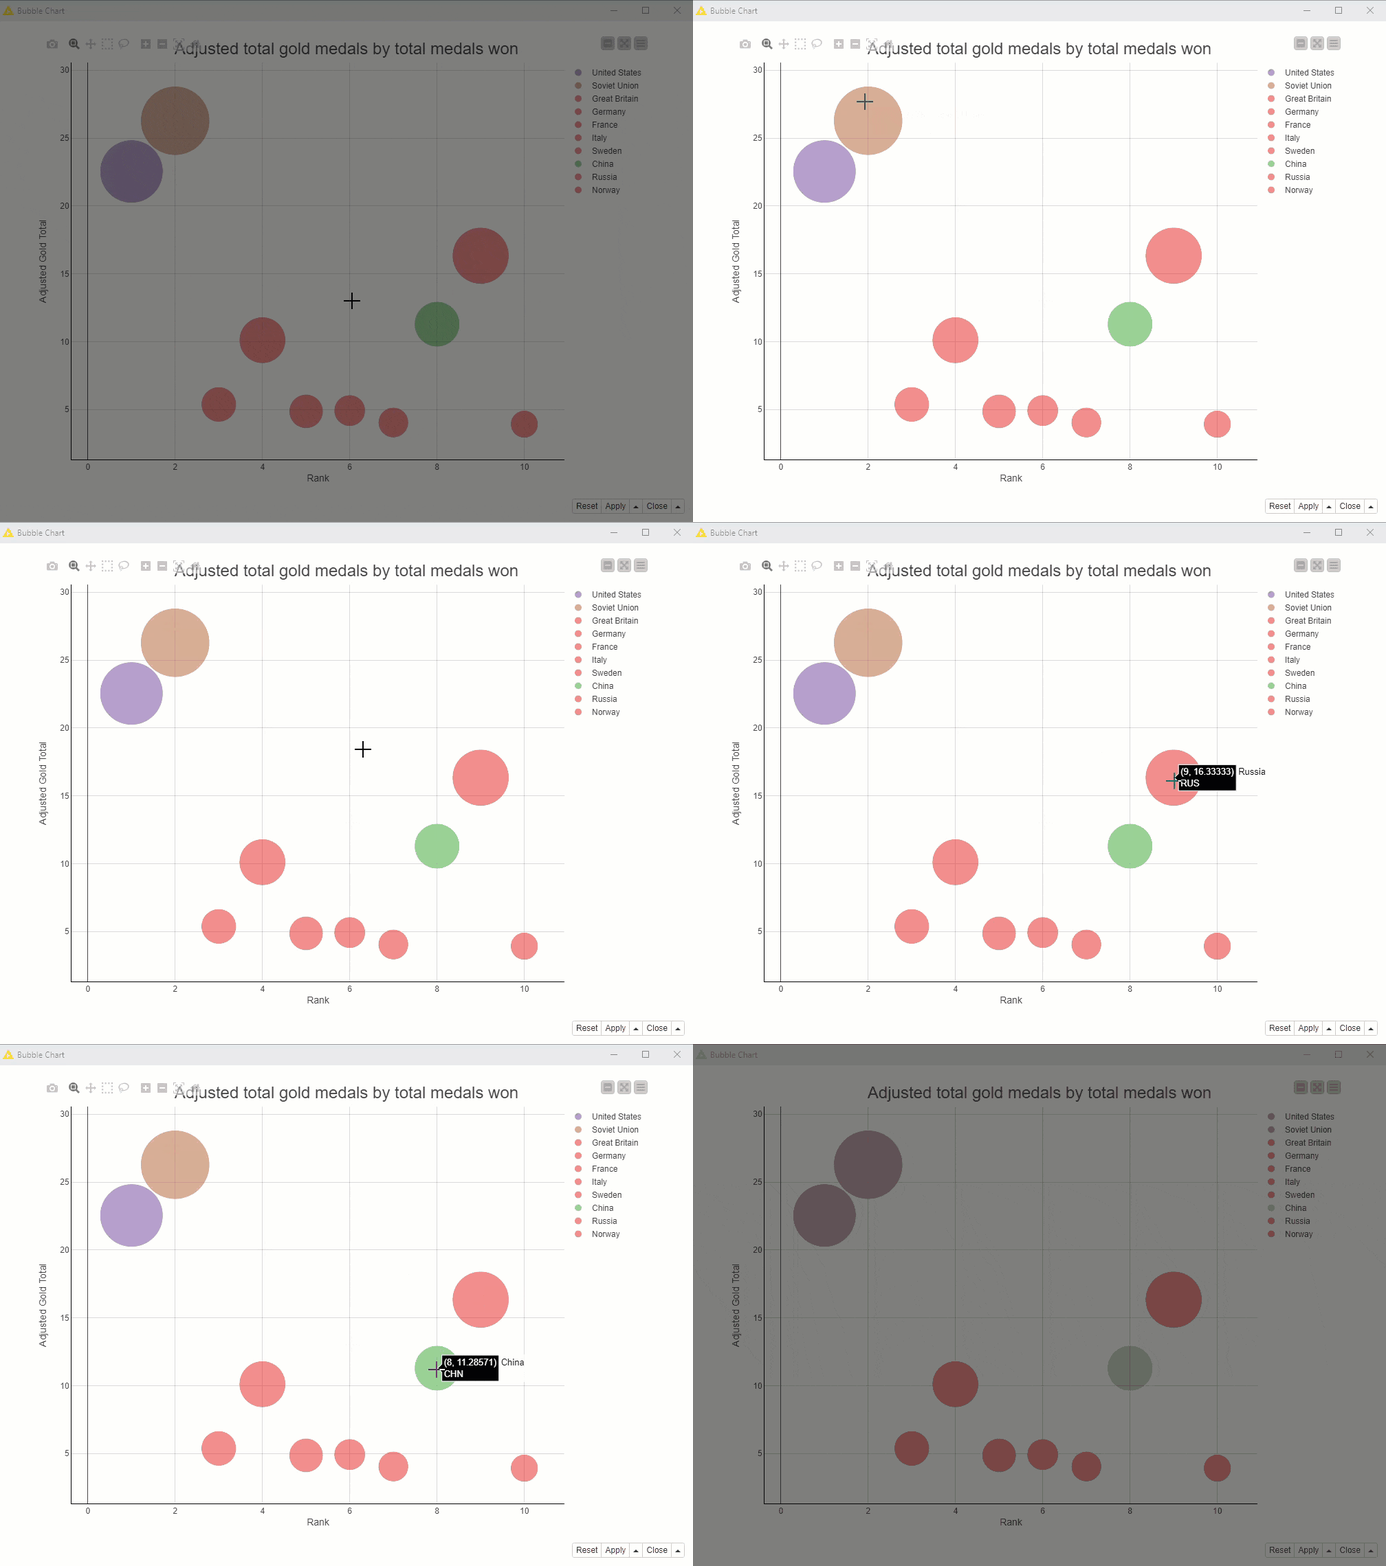
We use JavaScript Bubble Chart (Plotly) node to create an interactive bubble chart showing the value of adjusted gold medals (no. of total gold / no. of total games) vs. the rank concerning the number of total medals won.
The size of the bubble corresponds to an adjusted value of total medals (no. of medals / no. of total games) won, and the color corresponds to the continent (North America, Europe, or Asia) or brown for NA – Not Applicable in case of Soviet Union.
The bubble chart shows that the United States has the most number of total medals in summer and winter games, as indicated by the x-axis (rank). Norway has the least number of combined medals among the top ten.

Based on the values of the adjusted gold medals represented by the y-axis, the Soviet Union won the most gold medals relative to the number of Olympic games in which they participated, followed by the US and Russia, respectively.
The sizes of the bubbles suggest that the top three countries that won the most medals relative to the number of games they were part of are respectively, the Soviet Union, the US, and Russia.
To put it in perspective, by comparing France and China, the latter won fewer total medals overall (position on the x-axis). But taking into account the number of Olympic games played, China did win more gold medals (position on the y-axis) and total medals (bubble-size).
